Commerce & Optimization
MOL Group’s Integrated value chain turns crude oil into a range of refined products, which are moved and marketed for household, industrial, and transport use. In addition, MOL produces and sells petrochemicals worldwide and holds a leading position in the petrochemical sector in the Central Eastern Europe region.
DOWNSTREAM INTEGRATION (FUELS)1
Crude intake:
Russia: 63%
Seaborne: 33%
Own Production: 4%
15%
85%
37%
 Retail
39%

24%

MARKET SHARE (Eastern Europe Region) (%)2
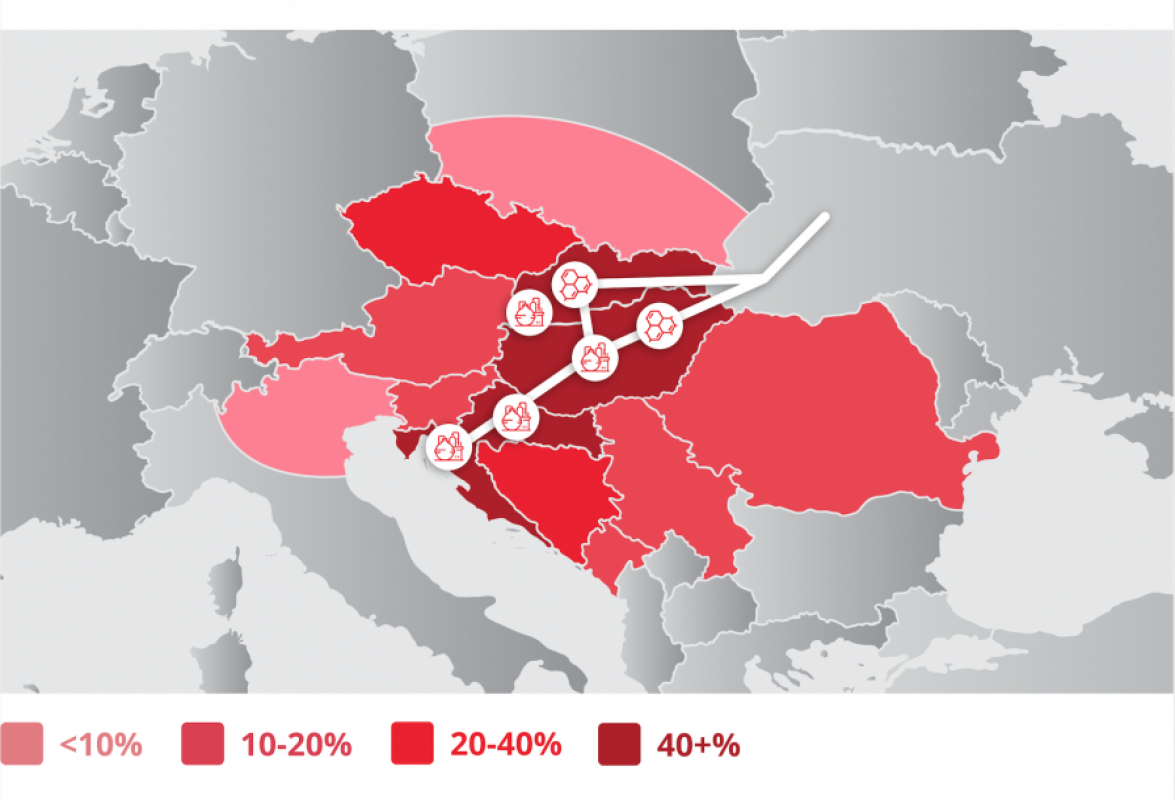
- Complex and flexible core refineries
- Retail network fully within refinery supply radius
- Enhanced access to alternative crude supply
- Deeply integrated portfolio of Downstream assets
- Strong land-locked market presence
(1) Estimation for 2018FY; (2) Including motor fuels, heating oil & naphtha of landlocked refineries
(3) Own market is calculated as sales to own Petchem and own retail over own production
| FY 2020 | FY 2021 | |
|---|---|---|
| External refined product sales (kt) - TOTAL refined products | 16 612 | 17 040 |
| Petrochemical sales (kt) – TOTAL outside MOL Group | 1 443 | 1 476 |
KEY PRIORITIES FOR THE UPCOMING 5 YEARS
- MAXIMIZE PROFITABILITY OF EXISTING MARKETS
- INTRODUCE NEW SERVICES & PRODUCTS
- DISCIPLINED COST CONTROL
- DEVELOP FURTHER CALUE-DRIVEN AND EFFICIENCY FOCUSED MINDSET
- UTILIZE DIGITALIZATION TO SUPPORT THE PREVIOUS AREAS
ROADMAP 2025


- FIXED OPEX CONTROL - SHORT TERM
- CONTINOUS IMPROVEMENT
- MAXIMIZE MARGIN CAPTURE
- NEW PRODUCTS & SERVICES
- ORGANIZATION SET-UP
- DIGITALIZATION
- SUSTAINABLE PRODUCTS
- TAKE ADVENTAGE OF OPPORTUNITIES
- COMPLIANCE WITH REGULATION
- CUSTOMER SATISFACTION
- COLLABORATION & TALENT MANAGEMENT
- CAPABILITY DEVELOPMENT


